An Overview of the Neuronix Cloud
Introduction
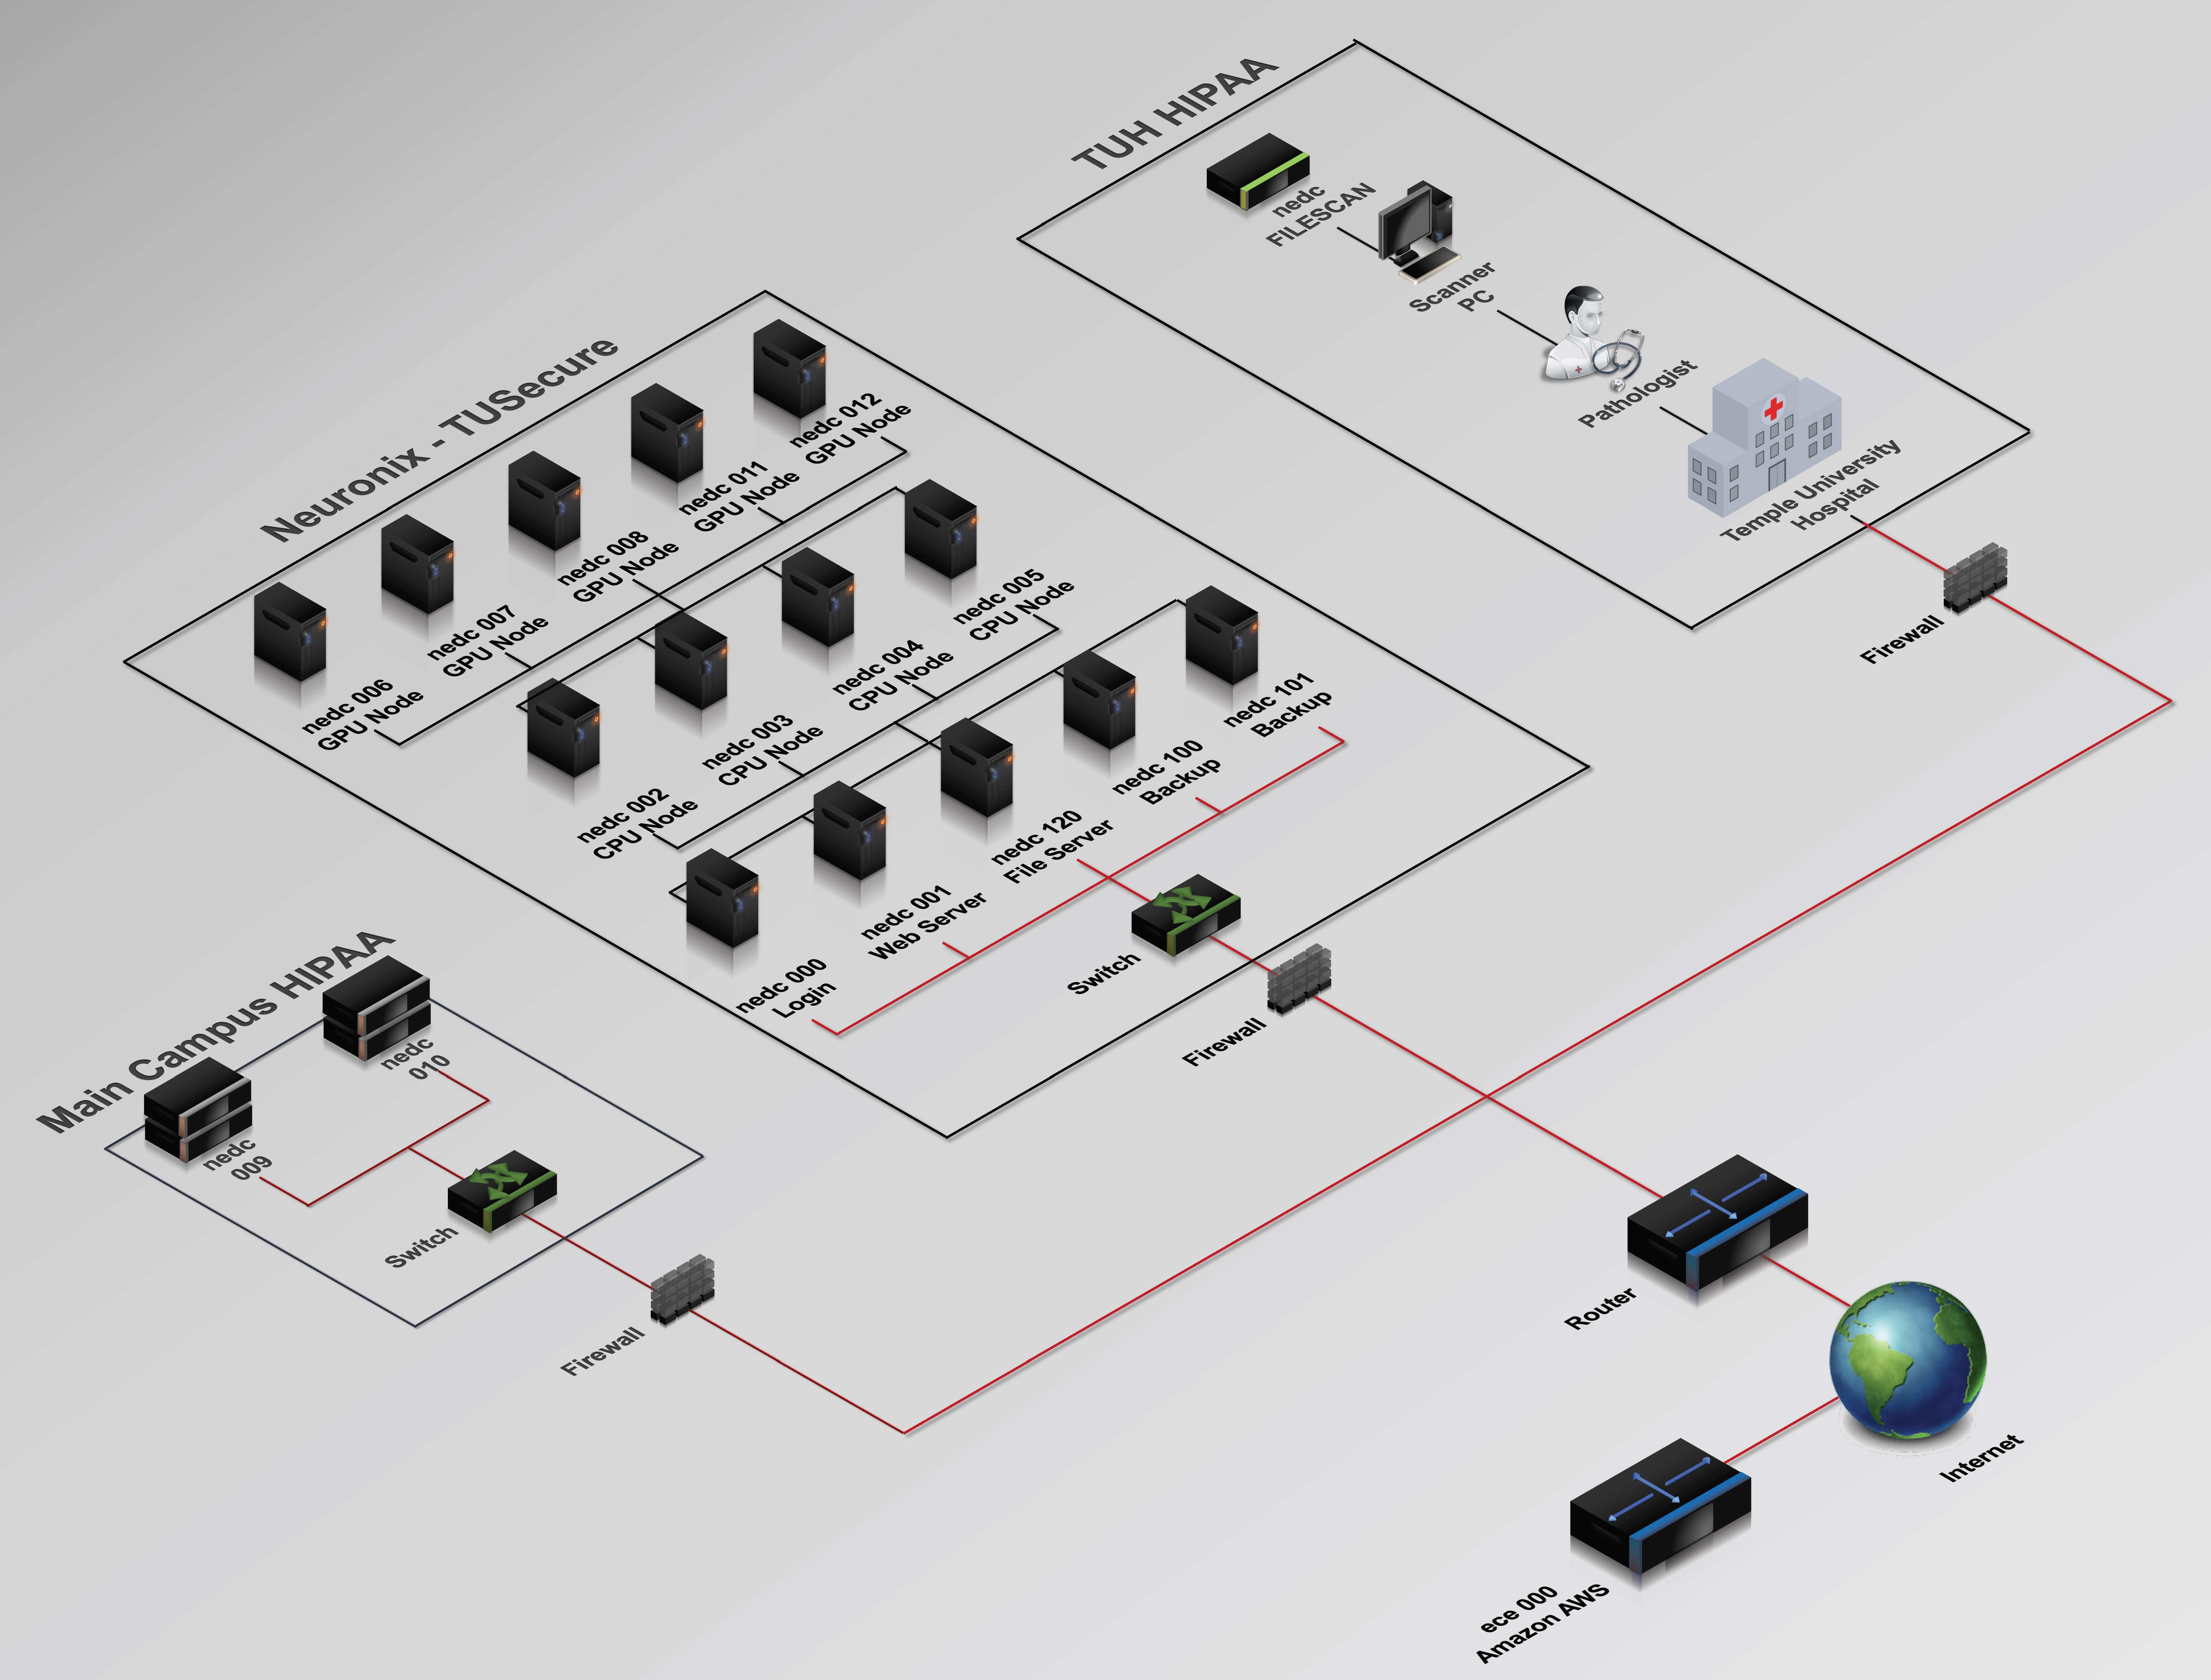
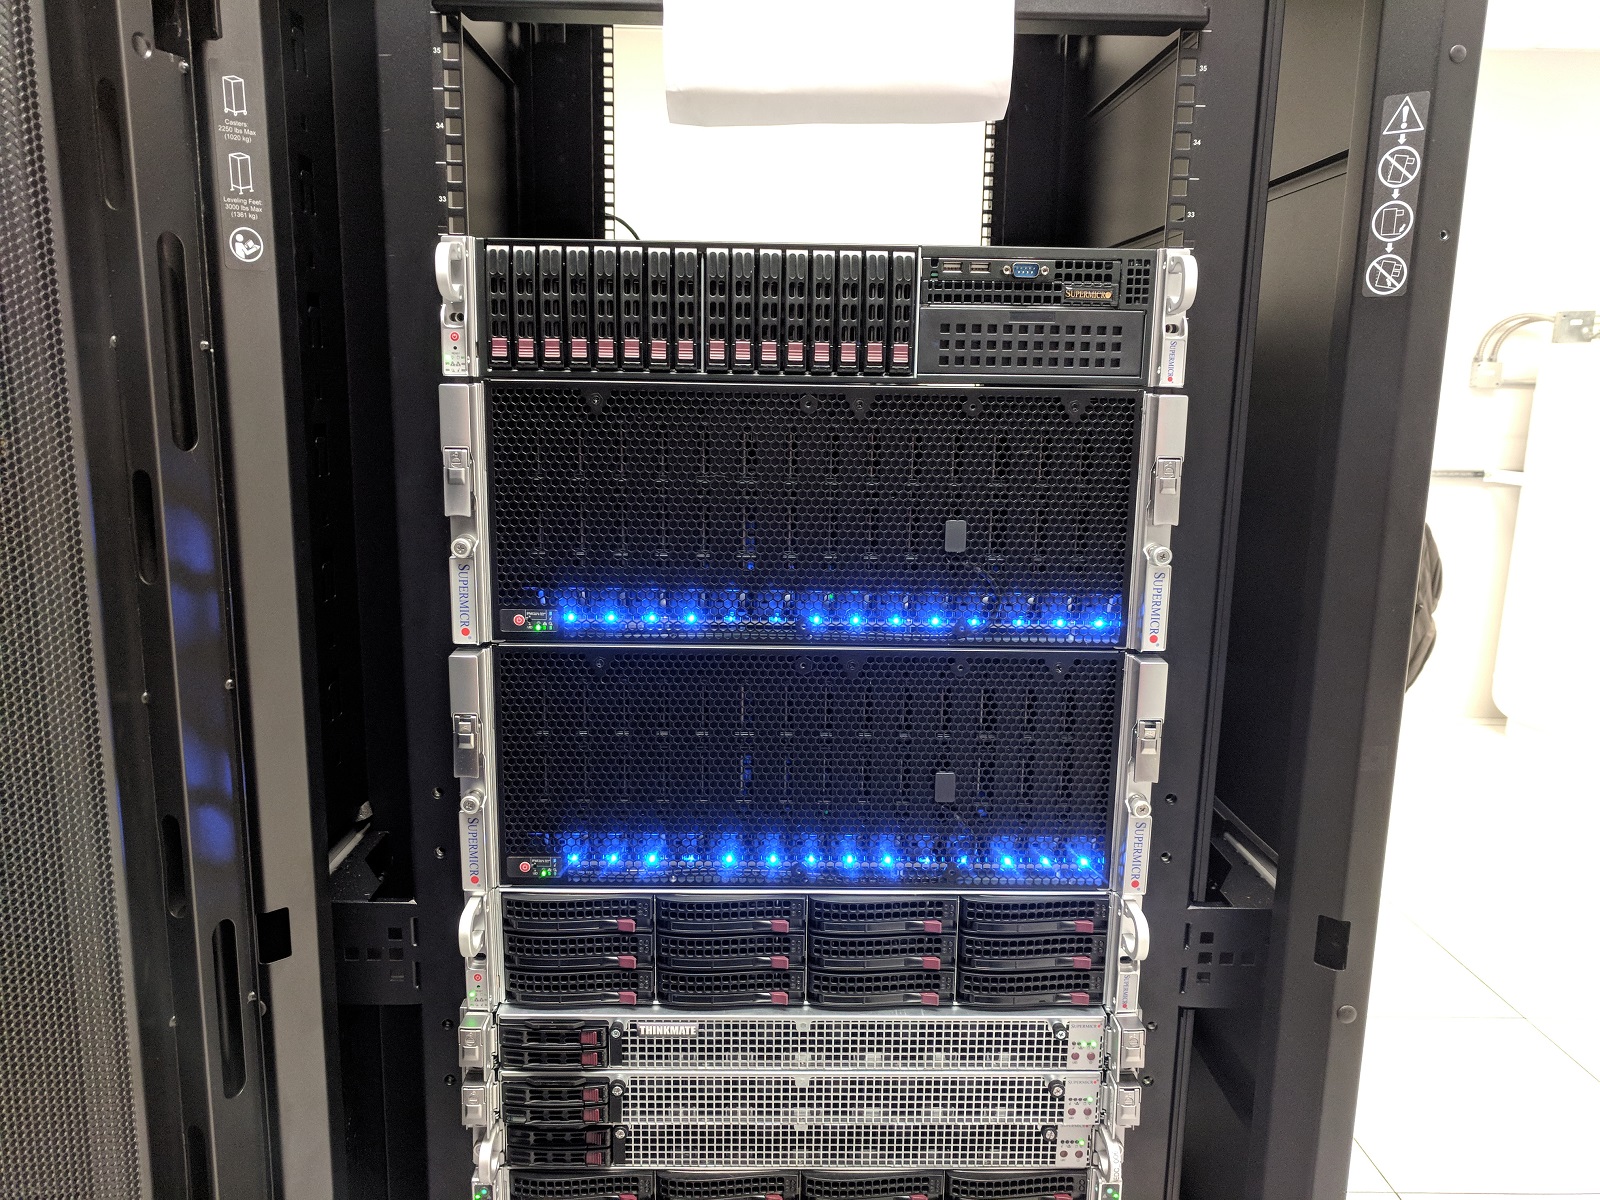
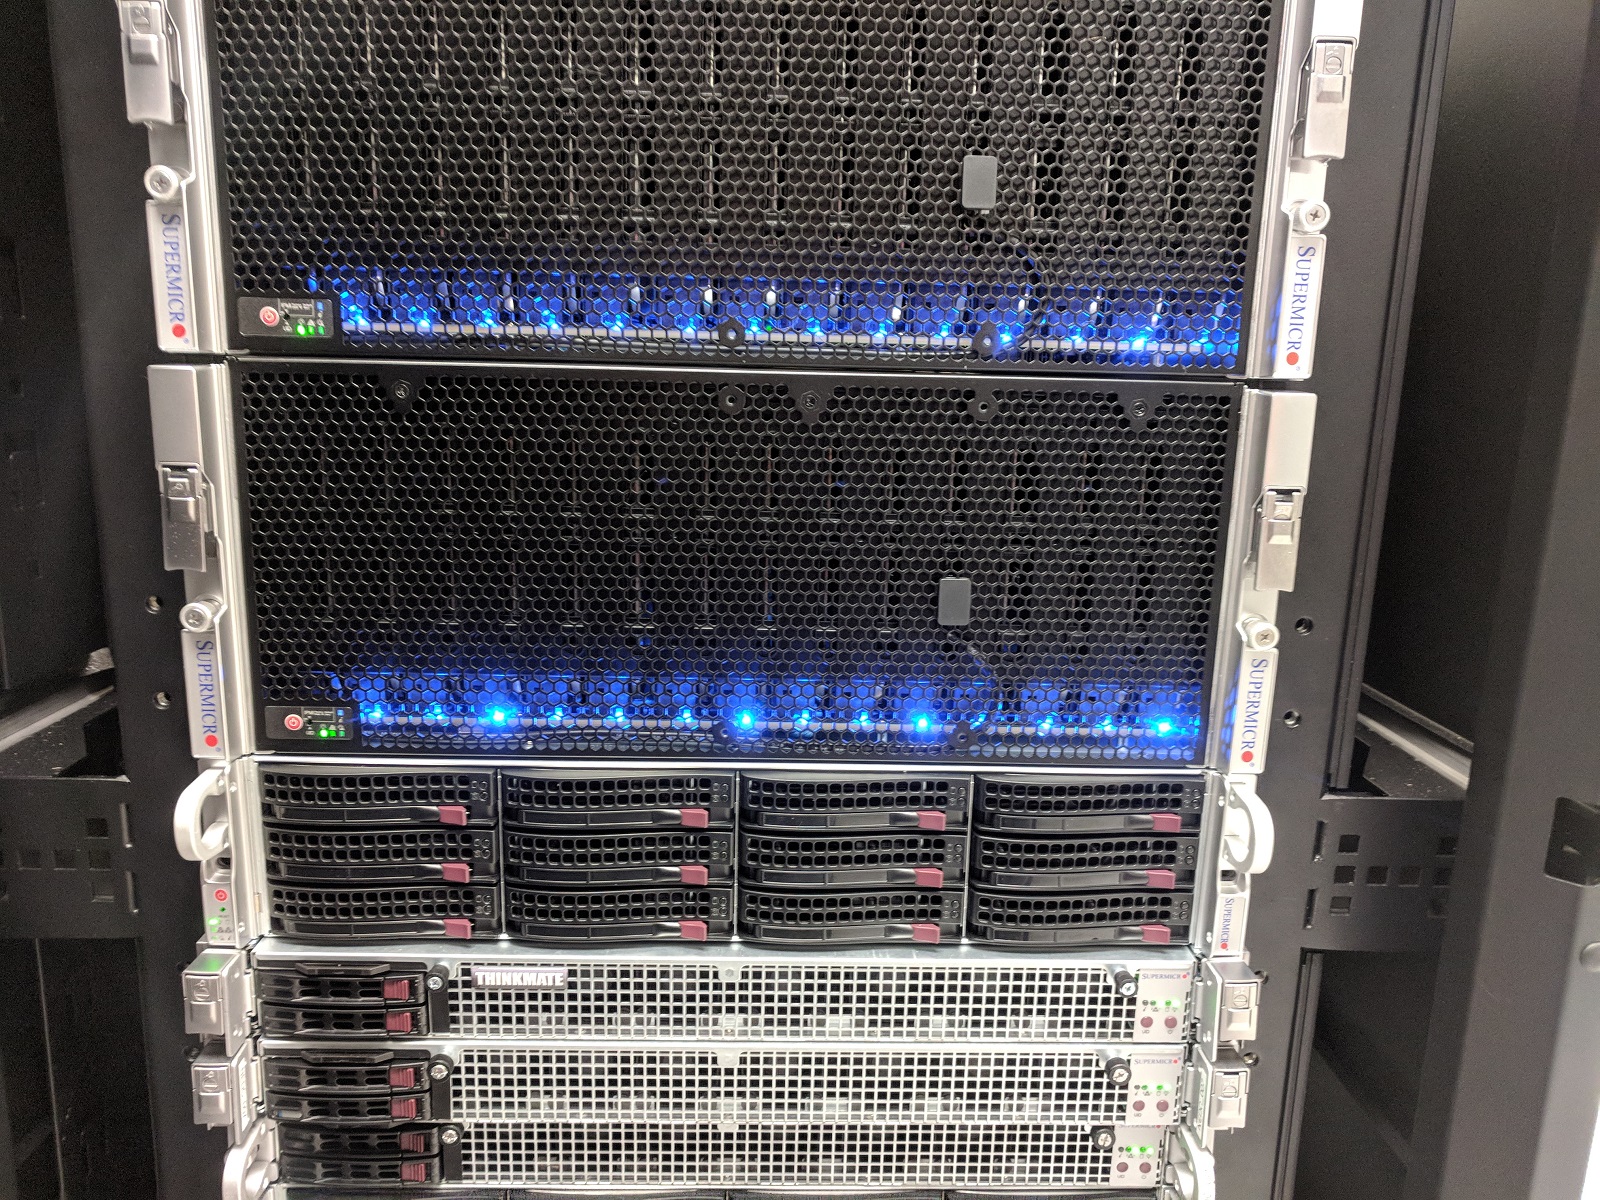
The Neuronix computing cloud, shown in Figure 1, supports Neural Engineering Data Consortium (NEDC) research into machine learning with application in bioengineering. Neuronix is the first computing environment at Temple University, and one of the few in existence around the world, to successfully span three restricted networks: Temple’s main campus network used by faculty and students, a Health Insurance Portability and Accountability Act (HIPAA) secure network used for health science-related research on Temple’s main campus and Temple University Hospital’s (TUH) HIPAA-secure production network. We can easily move data from the hospital to our research computers once it is anonymized and prepared for release. We can also directly support TUH physicians and healthcare workers who need to generate and access data as part of their normal workflows. Since hospital data is HIPAA protected, only anonymized data is allowed outside of the two HIPAA subnets. The cloud has been designed to maintain the high levels of security needed to accommodate HIPAA data.
The backbone of the cloud is the main campus cluster, the center portion of Figure 1, which consists of a cluster controller (nedc_000), a dedicated web server (nedc_001: www.isip.piconepress.com), 4 nodes containing AMD 16-core processors and 4 nodes containing a variety of Nvidia Graphic Processing Units. The Main Campus HIPAA network, shown in the lower left, hosts two 1 petabyte (PB) file servers that are used to store a large inventory of digital pathology images. The production TUH HIPAA network, shown in the upper right, hosts a Aperio/Leica Biosystems slide scanner and an application server that provides pathologists with a web-based interface to view the TUH Digital Pathology (DPATH) Corpus.
The Joint Data Center
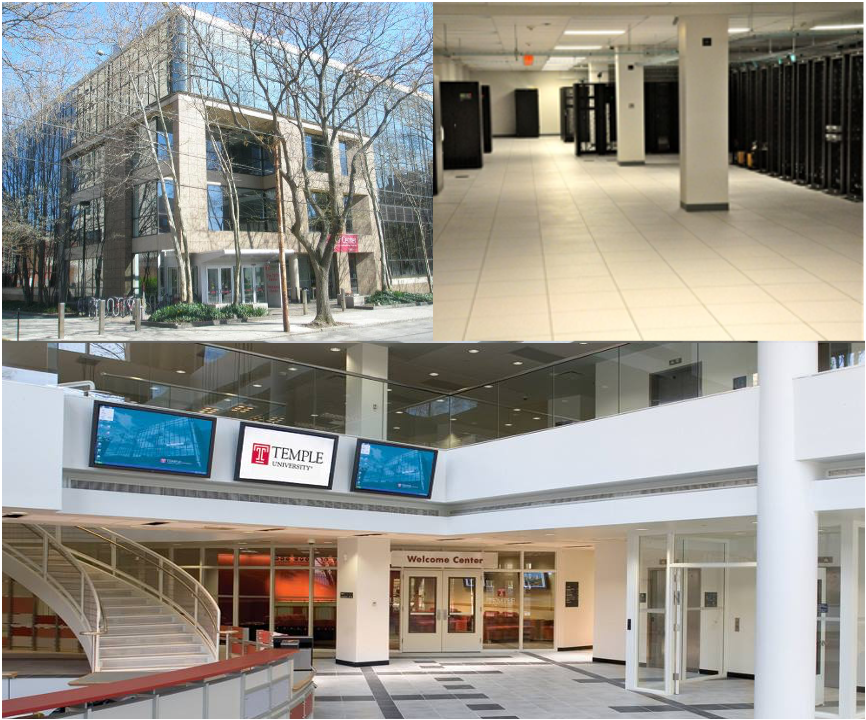
The first two networks are based in Temple University’s state of the art Joint Data Center (JDC) shown in Figure 2. An interesting historical note is that the JDC is housed in an old Bell Atlantic telephone switching building, which means it has ample power and air conditioning to handle the university’s computing needs. The JDC has redundant power and cooling and uses an inert gas fire suppression system. All major campus functions, including Internet connectivity are supported by fault tolerant systems. Continuity of operations is provided by a mirror site located in another building on campus. Both the JDC and its mirror site reside in secure locations that can only be accessed by authorized individuals. Its staff provides 24/7 support of our systems allowing us to maximize uptime
Supporting NEDC
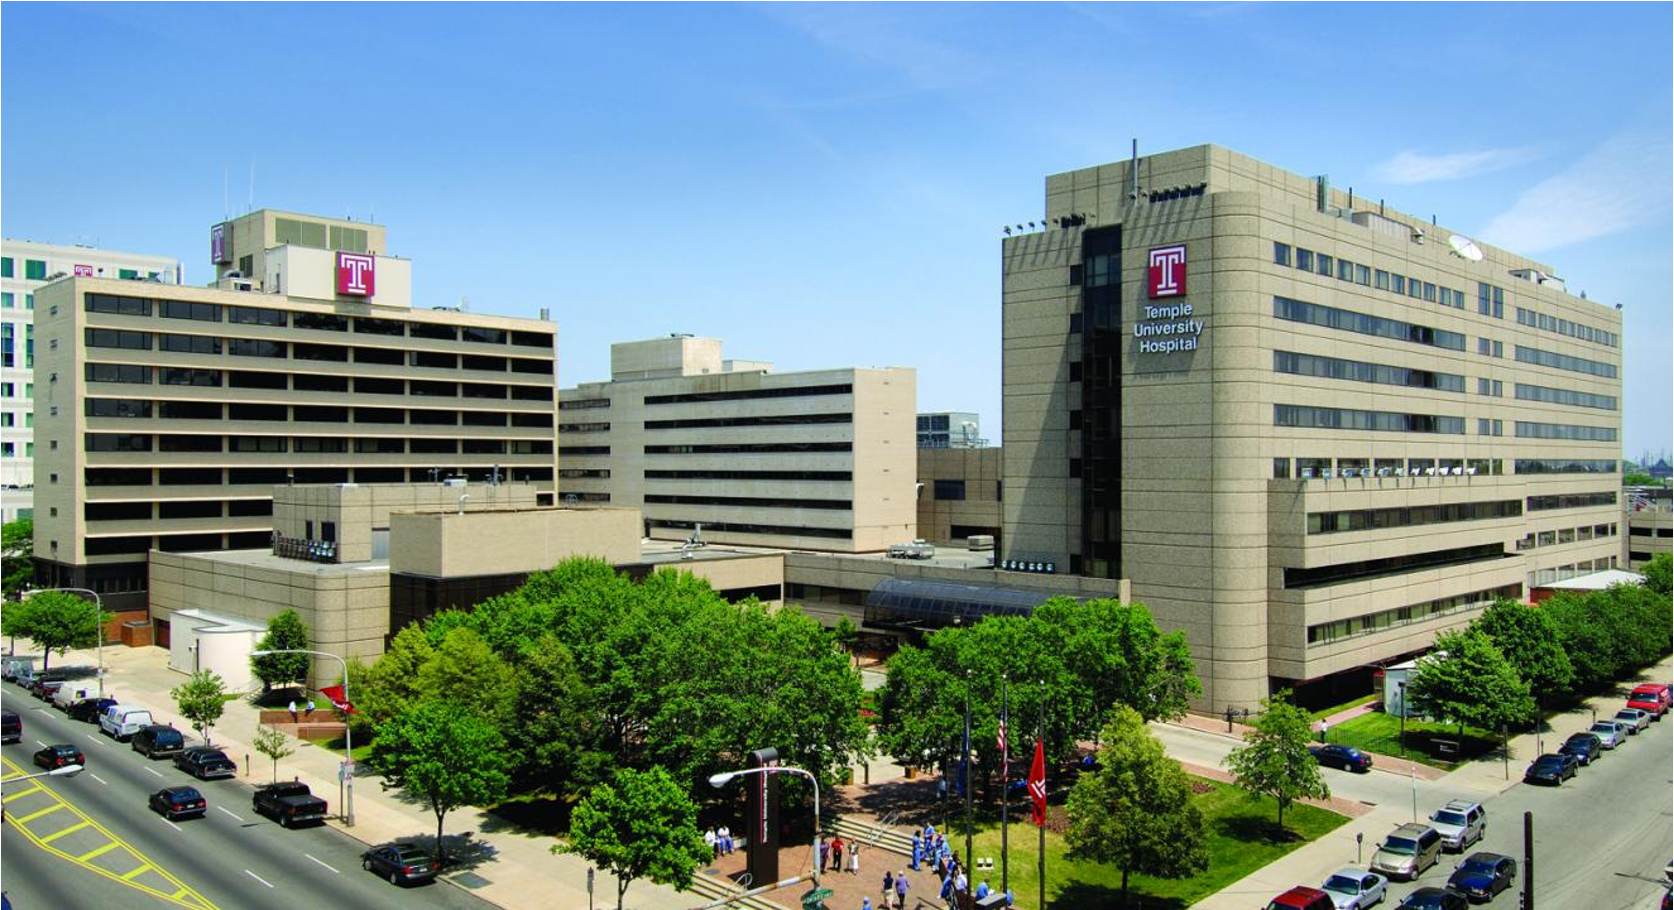
NEDC is a community-wide resource that focuses the attention of the research community on a progression of neural engineering research questions. It develops and distributes data designed to advance research in biomedical engineering. NEDC is a joint collaboration between Temple University Hospital (TUH) and Temple’s College of Engineering. TUH, shown in Figure 3 is a 728-bed comprehensive medical center that serves as the public hospital for the city of Philadelphia. Its diverse customer base makes it an ideal place to collect clinical data such as the TUH EEG Corpus.
NEDC also collaborates with Temple’s Lewis Katz School of Medicine. LKSM takes pride in the excellence of its teaching, research and service programs. It remains fully accredited by the Liaison Committee on Medical Education and employs 471 full-time faculty, 47 part-time faculty, 1,660 volunteer faculty, and 869 staff. Each year it admits 210 medical students and approximately 24 graduate students. TUSM recently completed the construction of an 11-story 480,000 sqft research building that contains state of the art facilities outfitted with the latest technologies for learning and discovery. The building is designed for current and emerging trends in medical education, such as virtual learning, clinical simulations, smart classrooms, interdisciplinary collaborations and small group endeavors. NEDC faculty collaborate closely with the Department of Neurology on EEG data acquisition and the Department of Pathology on a related proposal in digital pathology involving the development of the world’s largest open source database of pathology images.
NEDC currently serves over 3,500 customers and offers eight open source EEG-related corpora, including the TUH EEG Corpus and the TUH EEG Seizure Corpus. See www.isip.piconepress.com/projects/tuh_eeg for a more detailed listing of the resources currently available. We actively support users providing custom distributions of data and research support for software and data processing pro bono.
Web Services
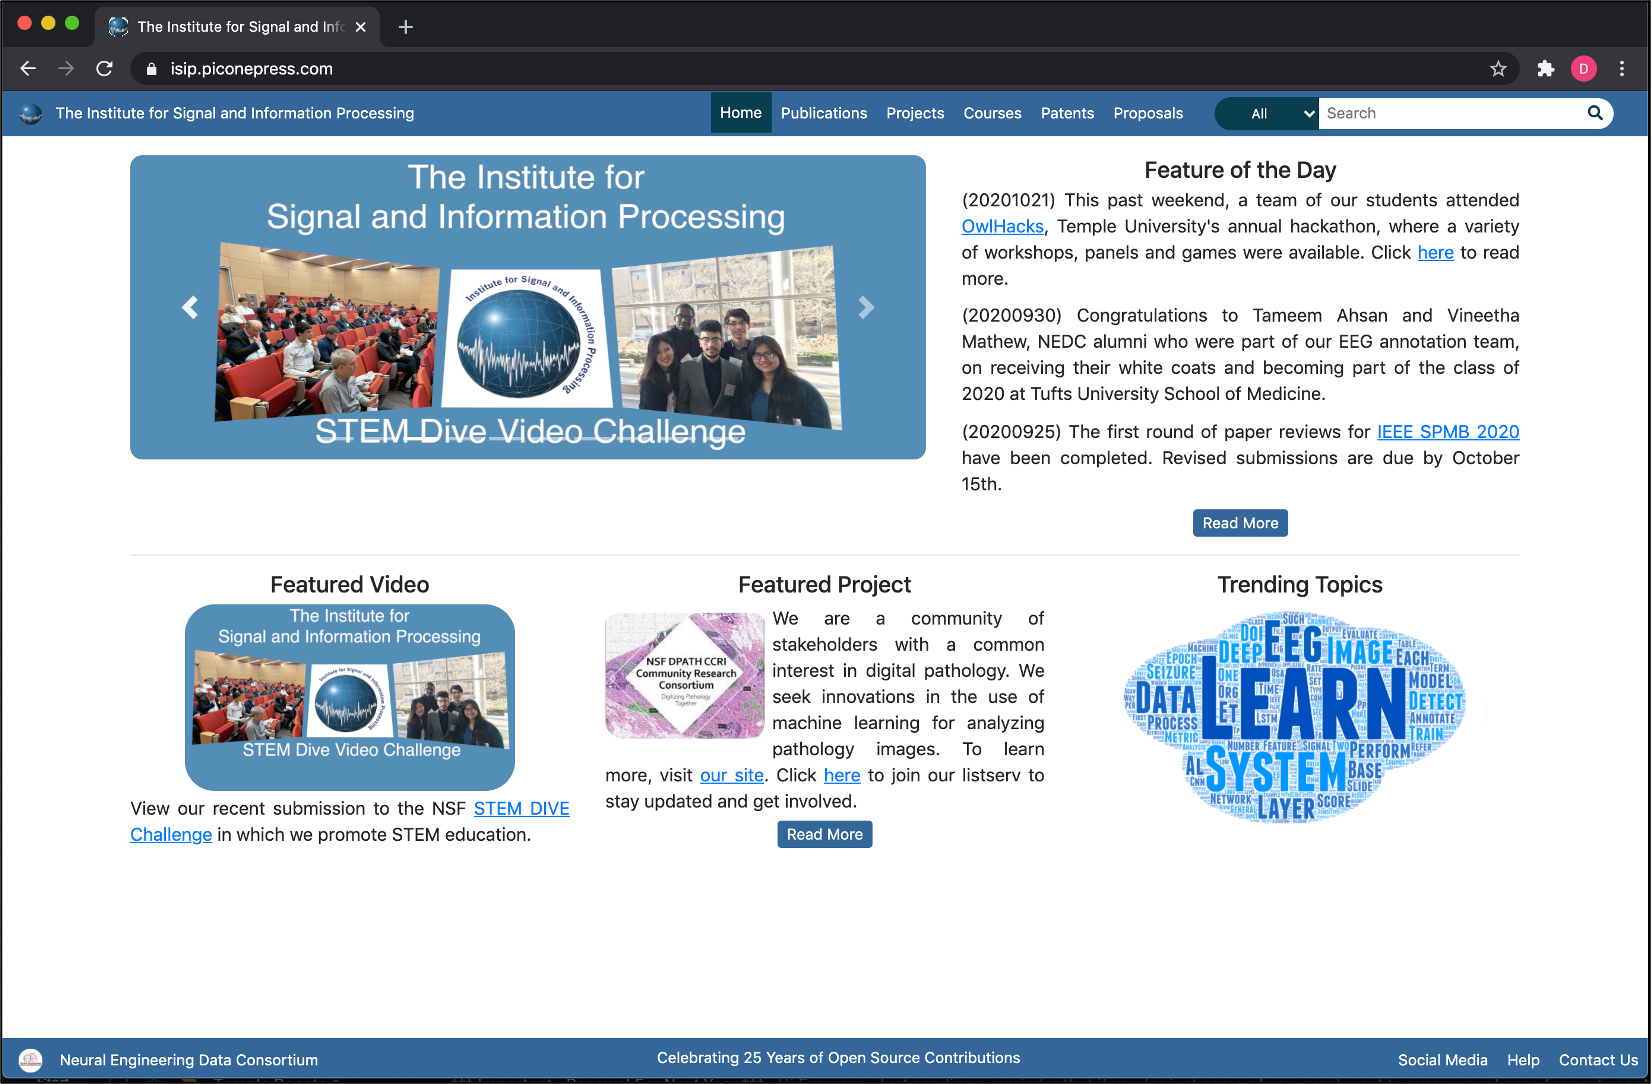
These resources are provided in several forms, including anonymous downloads from the NEDC web server (see nedc_001 in Table 1), which can be accessed from the URLs piconepress.com or nedcdata.org. Our primary web site, isip.piconepress.com, is shown in Figure 4. Our web server currently hosts about 40 TB of data including archives that reach back to the early 1990’s. It supports instructional needs, including hosting video recordings of lectures, research needs, including data, software and publications, and professional conferences, such as the IEEE Signal Processing in Medicine and Biology Symposium (ieeespmb.org). It is one of the longest running archives of signal and information processing resources in the community
The web server hosts several sites: The Institute for Signal and Information Processing (isip.piconepress.com), which is our flagship organization celebrating 30 years of being a leader in open source resources; The Neural Engineering Data Consortium (nedcdata.org), which is described above; BioSignal Analytics Inc. (biosignalanaltyics.com), which is our startup company focused on applications of machine learning to bioengineering; Ganglia (ganglia.nedcdata.org), a web-based tool we use to monitor our cloud; and Gitlab (gitlab.nedcdata.org), which we use to manage our software development process. We also maintain a help listserv (help@nedcdata.org) that is used to support both internal and external users.
One of the more important features of the web site is that it supports an anonymous rsync capability. This is the primary way that we distribute resources to our users. The rsync model of maintaining mirrors of data across two sites makes it very easy to keep our users abreast of changes and new releases. For users that do not have adequate bandwidth to download our resources, we provide a snail mail option through which we will send them a hard disk with the data. Most of our users prefer rsync as a distribution mechanism, though we still ship about one hard drive per month.
Within our organization, the web server is used to archive information about projects. Every project has a web site (isip.piconepress.com/projects) and every publication (isip.piconepress.com/publications) is made available as soon as possible, often while under development. Our web site receives an average of 5 new subscribers per day, 4 external support requests per day, and service hundreds of hits from external users.
The Core Cluster
Our main computing environment for research is referred to as the core cluster. This is comprised of a cluster controller (nedc_000 in Table 1), shown in Figure 5, four CPU-only compute nodes (nedc_002-5 in Table 1), four compute nodes with GPUs (nedc_006-8 and 011 in Table 1), and two backup servers (nedc_100 and 101 in Table 1) and an auxiliary file server/backup DNS server (nedc_120 in Table 1). The cluster controller hosts over 100 TB of high-speed disk storage and also serves as the login node for users. It manages key services such as account and batch job management throughout the network. Its disks are NSF-mounted by all the compute nodes over dual 1 Gigabit ethernet connections. It uses a ZFS file system to aggregate all our drives into one easy-to-manage data partition.
There are four CPU-only compute nodes available to users (see nedc_002-5 in Table 1). These nodes contain 4 processors with 16 cores per processor, giving us a total of 4x16x4 = 256 CPU cores. Each machine has 256 GB of memory to support memory-intensive applications such as signal processing using big data. There are also four nodes with a variety of GPUs including a GeForce GTX 980 Ti (4), a GeForce GTX 1070 (4), a Tesla P40 (4) and a GeForce RTX 2080 (4). The GPU nodes are the main workhorses for our machine learning research. These nodes are equipped with 4 GPUs and 128 GB of physical memory. GPU memory ranges from 8 GB on the older machines (nedc_006 and 007) to 24 GB on the newest GPUs (nedc_011). All machines are equipped with local 0.5GB solid state disks (SSDs). We use the open source job manager SLURM to submit and manage jobs on the compute nodes.
The density of the compute nodes, defined as “performance/(cost*volume)” is quite impressive. Our total investment in this cluster is approximately $100K, and it delivers over 160 TFLOPS, which translates to a very impressive 1.6 GFlop/$. We almost exclusively use GPUs and typically purchase these in a configuration that supports 4 GPUs per node at a cost of about $8K per node. We try to buy commodity priced GPUs because we don’t see significant performance improvements using the very high-end GPUs such as the Nvidia V100. We use software tools such as TensorFlow and PyTorch to make efficient use of these resources.
Databases in active use by researchers reside on nedc_000 and are archived on our backup servers when no longer being actively used. Experiments are carefully organized by database and number and are also archived when no longer relevant. We typically generate about 1,000 new experiments per year, and about 1 TB of annotated data per year.
The cluster controller disks and web server are backed up twice per day using two dedicated backup servers (see nedc_100 and 101 in Table 1). We run an incremental backup each day at noon which is stored on nedc_100 and run a full archival backup overnight which is stored on nedc_101.
Collaborations with TUH
An important part of NEDC’s mission is to develop technology that can improve healthcare. We work closely with clinicians at TUH to collect clinical data and study caregiver workflows. Our flagship project is an NSF Major Research Instrumentation Grant (Award No. CNS-1726188) in which we are developing a database of one million digital pathology slides (see www.isip.piconepress.com/projects/nsf_dpath/). This required the construction of two 1 Petabyte (PB) file servers (see nedc_009 and 010 in in Table 1). These were designed and built in 2018 at a cost of $45,000/PB. We work closely with Linux clone manufacturers to produce configurations that bring unprecedented value to our customers. Because these machines hold valuable HIPAA-protected data, they reside in Temple’s main campus HIPAA network so that hospital personnel can access the data seamlessly.
In order to collect data, however, we need a presence at TUH. We have two installation at the hospital: EEG data collection using a simple standalone Apple/Mac environment and digital pathology data collection using a digital slide scanner and databasing software. The EEG project is fairly straightforward and being executed using 32T USB drives and standalone Macs. The digital pathology project, however, is more involved.
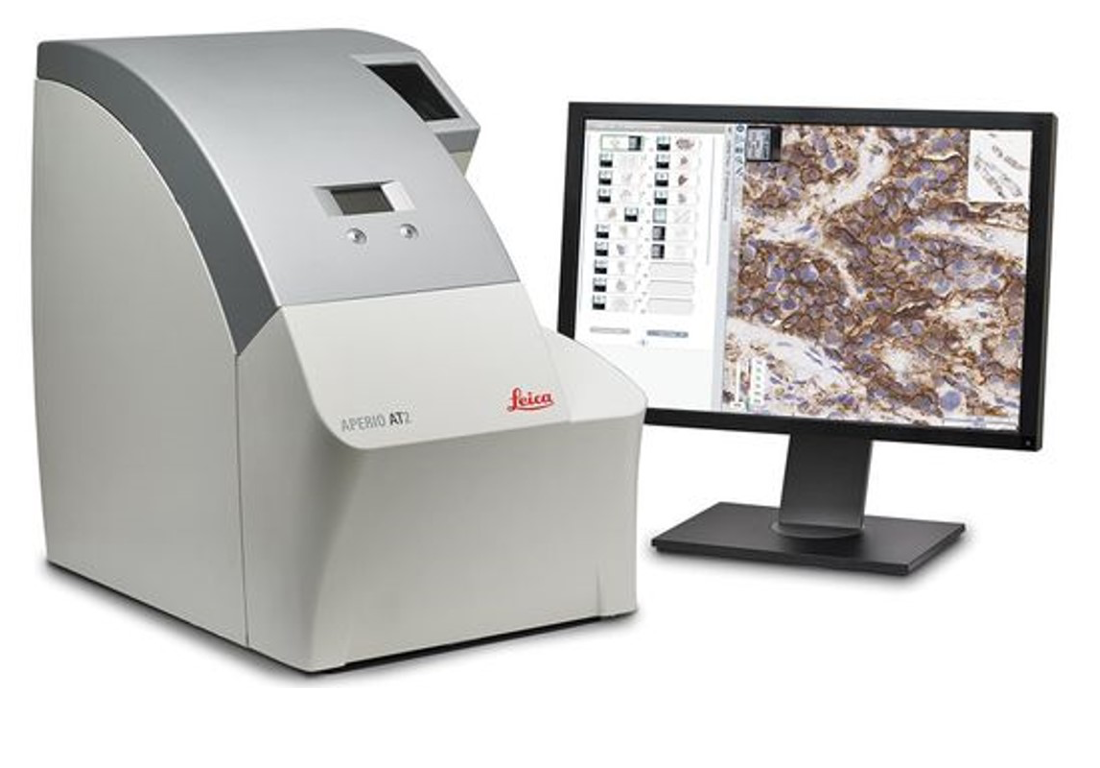
For scanning slides, we use an Aperio an Aperio/Leica Biosystems slide scanner, shown in Figure 7, and an application server that provides pathologists access to Aperio’s imaging software, eSlide Manager (eSM). This scanner is connected to a PC (see ss7463 in in Table 1) that runs the Windows operating system and uses an Aperio application. Images are scanned and uploaded to our HIPAA-protected file server, nedc_009. The redundant file server, nedc_010, mirrors nedc_009 using ZFS, so it is automatically updated as well. Pathologists access the data from a web-based application that is hosted on the machine nedc-slidescan (see Table 1). They access the Aperio application eSM via a URL. They are authenticated using their hospital credentials – essentially a single sign-on for them. They can then browse any of our images seamlessly even though those images reside on a file server that is connected to the web server via TUH firewall. From this web app they can view and annotate images. We can also access the same images using a VPN connection from main campus.
The Desktop Environment
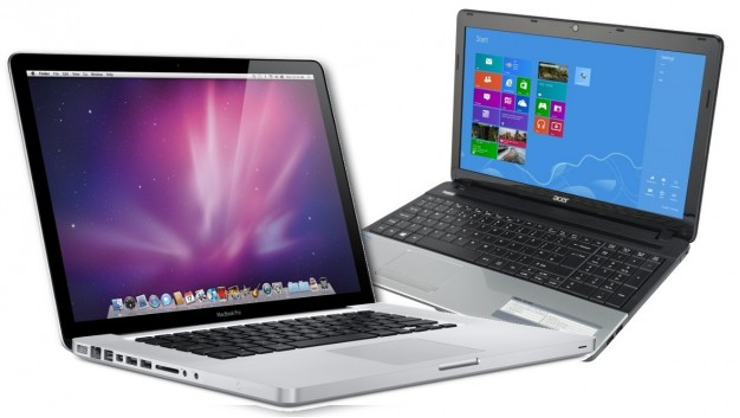
Our students use Windows or Mac laptops as their primary desktop environment and connect to the cluster via a variety of terminal emulators such as MobaXterm (Windows) and the Terminal Tool/ssh (Mac). We do not actively manage students’ laptops or desktop environments because they like to customize their environments. But, and this is important, we all use a common environment when logged into the cluster. We have been developing this environment for over 30 years and have created a powerful environment to do software development and distribution. We leverage GNU tools such as gcc and emacs for software development. We run our own Gitlab server to manage software development. We use Dropbox for short-term project-specific collaborations, and then archive these contents to our web server as appropriate for permanence.
We have written most of our visualization tools in Python so they run on the Windows, Mac and Linux operating systems. Our annotation teams typically run our Python tools in Windows using the Python distribution Anaconda. Though the number of students with Macs is growing, Windows is still the primary operating system used by our students in their academic programs. Some students dual-boot their machines with Linux, but most simply use a terminal emulator to connect to the cluster.
Summary and Future Directions
To learn more about the configurations of each machine, follow the links in Table 1.
| Function | Machine(s) |
|---|---|
| Cluster Controller | nedc_000 |
| Web Server | nedc_001 |
| CPU Compute Nodes | nedc_002, nedc_003, nedc_004, nedc_005 |
| GPU Nodes | nedc_006, nedc_007, nedc_008, nedc_011 |
| File Servers | nedc_009, nedc_010, nedc_120 |
| Backup Servers | nedc_100, nedc_101 |
| TUH Application Server | nedc-slidescan |
| TUH Scanner Host | ss7463 |
Aside from the obvious upgrades of more disk space and more compute nodes, the most interesting bottleneck in our current environment is GPU memory. As deep learning models continue to become more complex, the models will exceed the memory available in the GPUs. This places a greater burden on software developers to partition algorithms so that only a portion of the models or data need to reside in GPU memory. Some toolkits, such as TensorFlow, are moving in this direction. A second interesting bottleneck is related to the size of the digital pathology images. These images are often 50K pixels x 50K pixels. Iterating over such large images in high-level languages such as Python is very slow and prevents processing large numbers of these images effectively. While there are numerous techniques in Python that can be used to accelerate looping and processing, partitioning the problem so that subsets of these large images can be run efficiently on GPUs remains a challenge.
We have considered upgrading to more powerful GPUs such as the Nvidia V100 (Ampere). However, we have not seen significant decreases in computation time using these more powerful processors. Again, it seems to depend on how you move data in and out of the GPUs. This is a constant challenge – training programmers to be competent at processing data efficiently on a GPU.
Finally, disk access speeds are always an issue. We have recently taken steps to accelerate our ZFS file system by using SSDs as a cache. We are still evaluating the effectiveness of this approach. We are also recently making more use of the local SSDs available on each compute node. I/O bound jobs can be significantly accelerated using these. We continue to evaluate file server technology and expect that to be a major area of investment in the near future. Pathologists access the data from a web-based application that is hosted on the machine nedc-slidescan (see Table 1). They access the Aperio application eSM via a URL. They are authenticated using their hospital credentials – essentially a single sign-on for them. They can then browse any of our images seamlessly even though those images reside on a file server that is connected to the web server via TUH firewall. From this web app they can view and annotate images. We can also access the same images using a VPN connection from main campus.