The first thing the user needs to do is to start the applet. You could also download the source code from our web-site and compile it yourself. At this point in the tutorial we will assume that you can access the applet and that you have started it.
Once the applet has loaded, you will see the following screen:

2. Menu bar
The main menu contains the following choices: Signal, Window, Parameters, Go and Help. These choices allow the user to generate signals and view the resulting windowed signal, phase and magnitude spectra.

3. Generating the input signal
In order to generate a signal you will need to select a waveform (Custom, Cosine, Sinc, Unit, Triangle, Exp(-t), 1 - Exp(-t) and Exp(-t) * Cosine) from the choices listed under the Signal menu on the main bar:
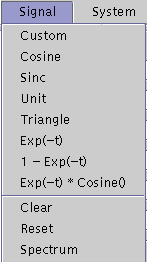
Note that in the following example, a user-defined Custom plot will be used to describe the generation of the signal. The procedure for generating other waveform is similar.
To generate a user-defined Custom plot select the Custom option under the Signal menu on the menu bar. After doing so the signal can be drawn, via the mouse, by left clicking on the signal panel. The following is a sawtooth waveform drawn on the signal panel using the Custom option:
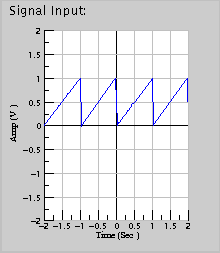
To clear the waveform currently being displayed on the signal panel, select the Clear option under the Signal menu on the menu bar. To reset the waveform currently being displayed on the signal panel, select the Reset option under the Signal menu. To view the magnitude spectrum of the waveform currently being displayed on the signal panel, select the Spectrum option under the Signal menu.
4. Generating the system response
In order to generate a signal you will need to select a waveform (Custom, Cosine, Sinc, Unit, Triangle, Exp(-t), 1 - Exp(-t) and Exp(-t) * Cosine) from the choices listed under the Signal menu on the main bar:
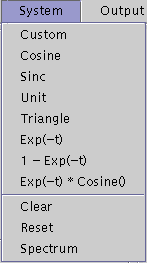
For this example let us select a cosine as the system response.

To clear the waveform currently being displayed on the signal panel, select the Clear option under the Signal menu on the menu bar. To reset the waveform currently being displayed on the signal panel, select the Reset option under the Signal menu. To view the magnitude spectrum of the waveform currently being displayed on the signal panel, select the Spectrum option under the Signal menu.
5. Changing parameters
In order to change the scales on any plot either before or after the waveform is generated, use the options under the Parameters menu (Signal, System, Output and Magnitude) on the menu bar. To change the signal parameters for instance, select the Signal option under the Parameters menu:
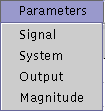
After selecting the Signal option under the Parameters menu you will see the corresponding signal parameters displayed in the top left conner of the applet:
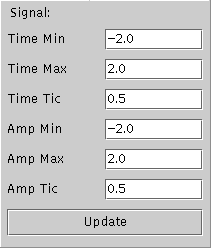
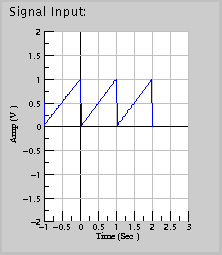
Change the signal scales (Time Min, Time Max, Time Tic, Amp Min, Amp Max and Amp Tic) to the limits you desire in text fields and click the Update button. Your changes will immediately be reflected. For example, if the signal scales for the sawtooth waveform were to be changed (Time Min = -1 and Time Max = 3) and the signal plot updated, the input signal would look something like this:
The scales on the other plots can also be changed in a similar manner.
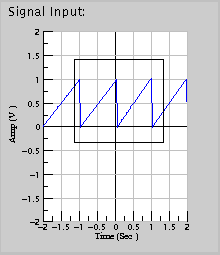
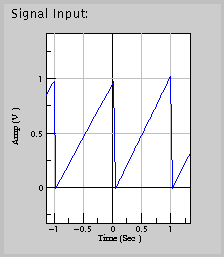
To zoom into any section of a plot, use the options under the Parameters menu as described above, or simply right click on the plot and drag the rectangle over the section of interest.
| Signal panel before zooming. | Signal panel after zooming. |
|
|
After you have generated the input signal and the system response in their respective panels, you can now compute the convolution by selecting the Convolve option under the Go menu.

To turn the animation option off while computing the convolved wavefrom, select unselect the Animate checkbox under the Go menu. To pause the animation process, select the Pause checkbox under the Go menu. Unselecting the pause checkbox will resume the animation process. To slow down or to speed up the animation process, select one of the three options (Slow, Medium and Fast) under the Go menu.
To following plots show the different stages of the convolution process. The subplot at the top displays the convolved wavefrom and the subplot at the bottom displays the input signal and the system response.
1. Initial stages of the convolution process.
2. Intermediate stage of the convolution process.
3. Final stages of the convolution process.
This is the end of the tutorial. We hope that this applet will help you gain a better insight into the fascinating world of convolution.


