MEL-FREQUENCY CEPSTRUM
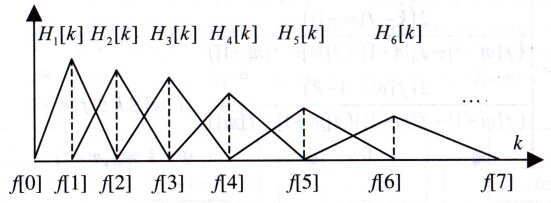
Recall our filterbank, which we construct in mel-frequency domain
using a triangularly-shaped weighting function applied to
mel-transformed log-magnitude spectral samples:
After computing the DFT, and the log magnitude spectrum (to obtain the
real cepstrum), we compute the filterbank outputs, and then
use a discrete cosine transform:
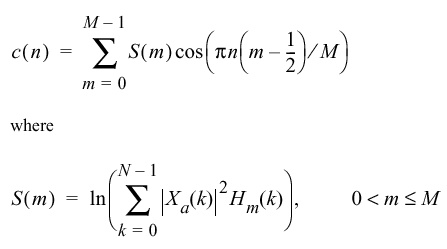 to compute the mel-frequency cepstrum coefficients. Note that
the triangular weighting functions are applied directly to the
magnitude spectrum, and then the logarithm is taken after the spectral
samples are averaged. The resulting coefficients are an approximation
to the the cepstrum, and in reality simply represent an orthogonal and
compact representation of the log magnitude spectrum.
to compute the mel-frequency cepstrum coefficients. Note that
the triangular weighting functions are applied directly to the
magnitude spectrum, and then the logarithm is taken after the spectral
samples are averaged. The resulting coefficients are an approximation
to the the cepstrum, and in reality simply represent an orthogonal and
compact representation of the log magnitude spectrum.
We typically use
24 filterbank samples
at an 8 kHz sampling frequency, and truncate the DCT
to 12 MFCC coefficients. Adding energy gives us a total of
13 coefficients
for our base feature vector.