USING THE C3X DSK DEBUGGER ON THE PC
The C31 DSK Debugger is only available on select PCs in the DSP Lab
because the program will only be loaded when a C31 DSP board is detected.
The debugger window consists of 4 panes as shown in the figure below.
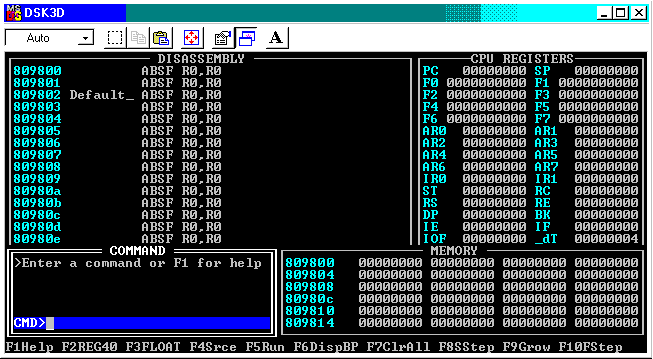
The top left pane is the DISASSEMBLY pane. It displays the
assembler program. If the source program is written in C, this screen will
display the compiled C program in assembler format.
The top right pane is the CPU REGISTERS pane. It displays
the contents of the registers, interrupts, program counter, stack pointer,
etc. It is usually displayed in 40-bit hex. To display the contents in
floating-point format, press the F3 key. Pressing the F2
key will revert this display to hexadecimal format.
The COMMAND pane is located on the bottom left and allows the
user to enter commands in the debugger.
The MEMORY pane is the bottom right pane and displays the content
of the memory locations indicated by the address on the left. The content
is also displayed in 40-bit hex format.
USING THE DEBUGGER:
-
To activate the debugger program, click on
Start->Programs->DSP Lab Tools->C31 DSK Debugger.
- Before loading a program, it is always a good practice to first
reset the debugger with the reset command.
- To load a program, type load filename.out or
load filename.dsk at the CMD prompt in the
COMMAND pane.
- You can now either step through the program using
function key F8 or run the entire program by pressing
function key F5. If you
are running the entire program, you would need to halt the program first
before you can view any changes to the data stored in memory. Pressing
Enter would halt the running program.
- To quit the debugger, type quit at the CMD prompt
in the COMMAND pane.
ADDITIONAL FEATURES:
-
The debugger also allows assembling of stand-alone assembler files
in the COMMAND pane by typing dsk3a filename.asm
at the CMD prompt.
The most commonly used commands can be found in our
reference guide for the simulator
and debugger.